
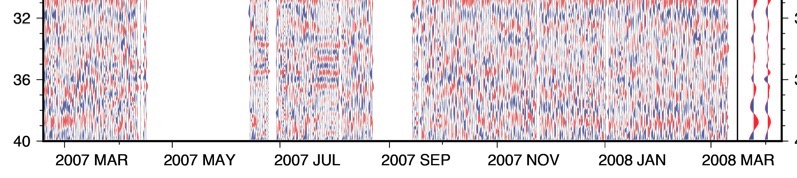
After the release of GMT5.3.0, pssac has been included into the GMT package. PSSAC operates a more convenient way than pswiggle or psxy to plot with SAC file (a common file format used in seismology community). We no longer have to convert SAC files into XY files and plot them by sorting them manually. PSSAC provides several types of regular profile like sorting by azimuth, epicentral distance, or user-defined profile through -E arguments. However, there is no direct argument in -E to plot such a figure with a cartesian time of X-axis (or Y if given -Q). In this article, we provide the trick for plotting SAC file in an axis of time.
- Determine the exact time of the SAC file.
- For example, this SAC file corresponds to the daily information on 2019-01-01
- The default origin time in GMT is at 1970-01-01T00:00:00, which is also known as the UNIX time epoch. To place the trace correctly, we have to compute the relative time since epoch time by the following command
date -d 2019-01-01 +"%s"
output: 1546272000
- Write the computed epoch time into SAC header (user0~user9).
- Plot the SAC files with the -Eu[n] (n is the number of the header which contains the epoch time.
A minimum program for the steps above is
#!/bin/sh
date=2019-01-01T
epoch=`date -d "${date}" +"%s"`
sac << EOF
  r FILE.SAC
  ch user0 $epoch
  wh
  q
EOF
gmt pssac FILE.SAC  -J -B -R -Eu0  -W1 > output
Generally speaking, the use of usern enables us to have the profile in what we desire.